This graph shows overall GDP growth as well as per-capita growth in the pre-Cha'vez (1986-1999) era and the Cha'vez presidency.
From 1999-2003, the government did not control the state oil company; in fact, it was controlled by his opponents, who used it to try to overthrow the government, including the devastating oil strike of 2002--2003. For that reason, a better measure of economic growth under the Cha'vez government would start after it got control over the state oil company, and therefore the economy.
Above you can see this growth both measured from 2004, and for the 1999-2012 period. We use 2004 because to start with 2003, a depressed year due to the oil strike, would exaggerate GDP growth during this period; by 2004, the economy had caught up with its pre-strike level of output. Growth after the government got control of the state oil company was much faster.
*
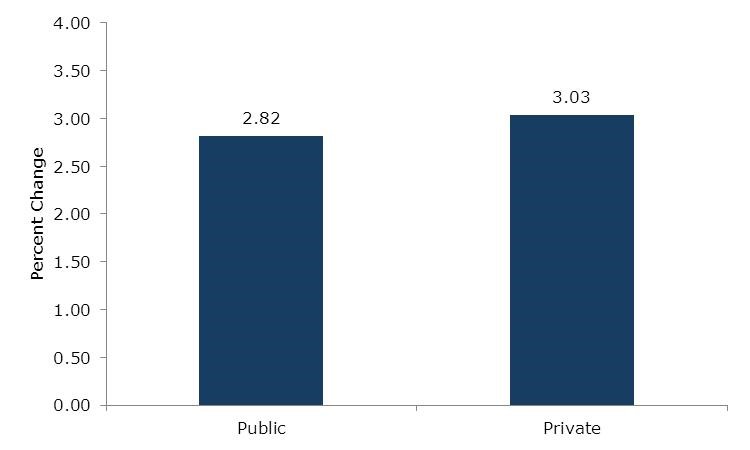
2. Public vs. Private Growth - 1999-2012 (Average Annual Percent)

Public vs. Private Growth Â? 1999-2012 (Average Annual Percent)
(Image by Center for Economic and Policy Research) Details DMCA
Source: Banco Central de Venezuela
This graph shows the growth of the private sector versus the public sector during the Cha'vez years.
*
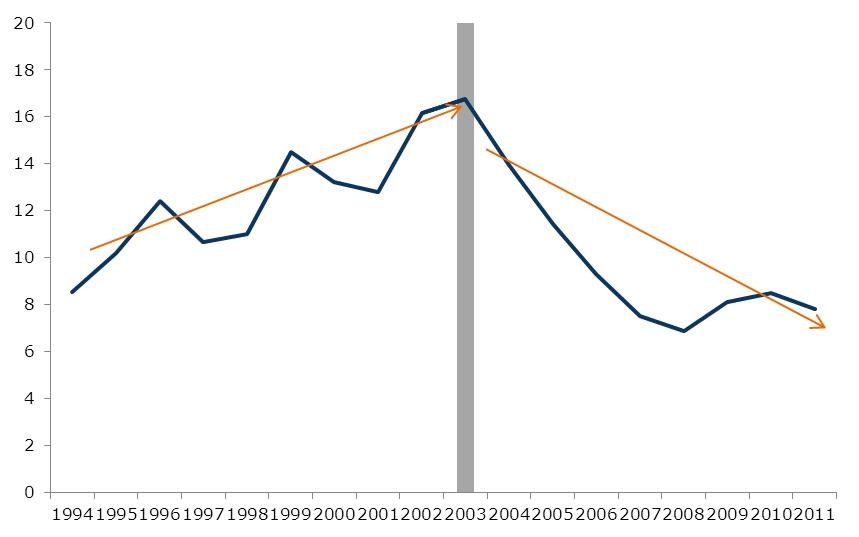
3. Inflation: Pre-Cha'vez vs. Cha'vez Years

3. Inflation: Pre-Cha'vez vs. Cha'vez Years
(Image by Center for Economic and Policy Research) Details DMCA
Source: Banco Central de Venezuela, INEC
Inflation in Venezuela, consumer price index.
*
Next Page 1 | 2 | 3 | 4 | 5 | 6 | 7 | 8 | 9 | 10
(Note: You can view every article as one long page if you sign up as an Advocate Member, or higher).


