






Who Owns What In America?
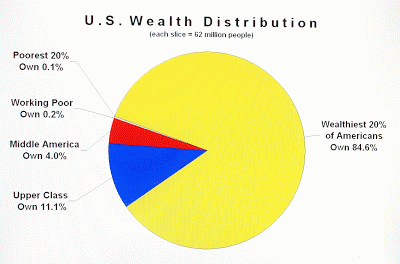
The distribution of wealth ownership, as opposed to income inequality, is even more skewed towards the wealthy as the pie chart below shows. The whole pie represents the total wealth in America. Each of the five slices of the pie represent 20% of the US population according to how much wealth they own.
Wealth Distribution by Brian Lynch
The slice of ownership for the poor and working poor are barely visible. Eighty-percent of all Americans own just 15.6% of America's wealth. The number of people who slipped into poverty in 2010 was at an all time high of 46.2 million, so the poorest 20% of all Americans, in terms of wealth ownership, includes 15.5 million who are technically above the income poverty line. The poorest 40% of Americans essentially own almost nothing while the top 20% own almost 85% of everything. As a result, favorable tax policies for capital gains income has a highly disproportional benefit for the wealthiest Americans. Capital income for this wealthy segment is what drives rising income inequality today.
___________________________________________________________
Changes in Income Inequality Among U.S. Tax Filers Between 1991 and 2006: The Role of Wages, Capital Income, and Taxes Thomas L. HungerfordHIGHLIGHTS FROM THIS REPORT:
Research has demonstrated that large income and class disparities adversely affect health and economic well-being (see, for example, Marmot 2004, Wilkinson 1996, Frank 2007, Singh and Siahpush 2006).
Research has shown, however, that income mobility [in the United States] is not very great and the degree of income mobility has either remained unchanged or decreased since the 1970's (Hungerford 2011, and Bradbury 2011).
Earnings inequality has been increasing since at least the late-1960s (Kopczuk, Saez, and Song 2010). [The] CBO (2011) has documented that income inequality has been increasing in the United States over the past 35 years.
Three potential causes of the increase in after-tax income inequality between 1991 and 2006 are examined in the analysis: changes in labor income (wages and salaries), changes in capital income (interest income, capital gains, dividends, and business income), and changes in taxes.
Increased salaries paid to CEOs, managers, financial professionals, and athletes, is estimated to account for 70 percent of the increase in the share of income going to the richest Americans (Bakija, Cole, and Heim 2010).
A declining real minimum wage could affect lower income tax filers (the inflation-adjusted minimum wage fell from $6.57 per hour in 1996 to $5.57 per hour in 2006).
(Note: You can view every article as one long page if you sign up as an Advocate Member, or higher).
 2
2
 1
1
 1
1