Update: The final count is not in (see below) but is looks very much like Scotland's voters have turned down independence and freedom from the United Kingdom 54% to 46%.. The election has been close and this is not exactly a surprise.
Here's the question for the UK: If 46% of the people in nearly 50% of the space of the UK don't see it as their country, what legitimacy does the UK have as a government? Interesting question. We will see how this plays out. The political promises made to Scotland in the case of a No vote are already unraveling. If they're not delivered, a large portion of that 54% who voted No may be a bit upset.
See the final chart below to see how Yes lost in localities where it was expected to win.
At least this spares us the excruciating agony of seeing several thousand people on the Shetland Islands claiming their own independence and 30% or so of North Sea oil revenues.
-------------
Scotland held its independence referendum Thursday September 18. Turnout should be high since 97% of eligible voters registered. They went to the polls all across the country and cast paper ballots. Those ballots are being counted or have been counted and reported as you read this.
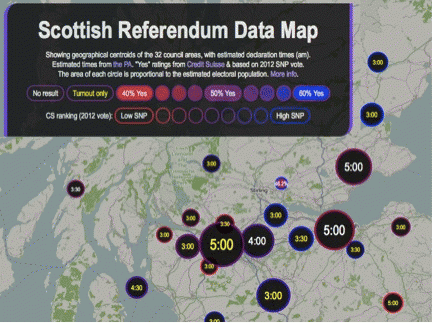
He're is an excellent resource to follow the results. It comes from Oliver O'Brien's Suprageography Blog - Scottish Independence Referendum: Data Map
Just run your cursor over the locality - the circles - and you'll see the Yes-No results plus other data. Results are just now coming in 11:40 PM, EDT.
O'Brien created a matrix of locality, % of population, and likelihood of voting yes (0=not at all; 10=highly likely). Based on that, it looks like a yes vote but who know.
This is a great day for democracy, a civilized election on paper ballots, counted for all to see. The digital cartography on the map is first rate.
Extrapolation from data matrix on map (which turned out to be too favorable to Yes - see table below, updated)
Basis for graph above (from O'Brien)
Update:
There was no miracle. Here are the final results with data reported by heraldscotland.
These are the final results, absent a couple of cities. The cities/localities marked in yellow at the top of the chart are those where Yes was expected to win but ended up losing. That begins to explain things. Another part of the explanation is the fear campaign from London: you will lose the pound, there will be a depression (Deutsche Bank); jobs will flee Scotland; the North Sea oil will go the the Shetland Islands; the Yes campaigners are "bullies;" and a litany of other nonsense. Nothing like fear mongering to win an election.


