Does voter fraud happen at any degree of frequency? Are there hordes of unqualified voters who manage to vote illegally without detection?
The Politics of Voter Fraud, L.C. Minnite (p. 9)
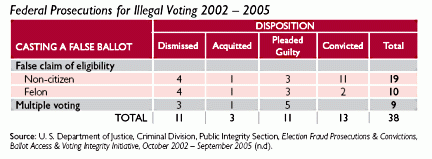
This Federal statistics show hardly any voter fraud prosecutions by the Department of Justice. Where's the epidemic of voter fraud or even a significant problem?
This evidence should be definitive. Only 38 cases of voter fraud were prosecuted from October 2002 through September 2005. Fourteen cases were dismissed and 24 resulted in guilty pleas or convictions.
There were 120 million voters casting ballots in the 2004 election. Add the total number of voters in all the other federal elections between October 2002 and September 2005. The total prosecutable cases of voter fraud that the U.S. Department of Justice could find consisted of 38 charged and 24 convicted. There is no epidemic of voter fraud.
It is imperative that we understand that the voter fraud epidemic is a pure fabrication and fantasy.
Since voter fraud barely exists, there is no rationale for tightening voter identification requirements. Given the real risk of reducing turnout there is every reason to avoid any additional laws that inhibit voters and voting. Yet twenty-five states have significant voter identification requirements, including seven that mandate official photo identification. The Court gave a green light to all states to create meaningless identification requirements if it serves the majority interests in state legislatures.
Photo ID's as an Effective Barrier to Voting
A statewide survey of 1,000 registered voters was conducted in Indiana in 2007 by the Institute for the Study of Ethnicity and Race, University of Washington. The study measured the impact of Indiana's new voter identification requirement, the law upheld by the Supreme Court. The highly pertinent results below show the clear bias of the law:
Data from Tables 1.1, 1.1.b, and 2.1 (pp. 18-19)
Six percent fewer black registered voters reported sufficient voter identification for Indiana elections. Of the general population, a pool for new voters, nearly 12% fewer black citizens have sufficient identification.
In addition, the Indiana study found that 21% of registered voters without a high school diploma lacked sufficient identification to vote while 11.5% with a college diploma lacked sufficient identification.
Most pertinent to the 2008 presidential election, the study confirmed the political bias of the Indiana voter identification law. The study concluded:
"Among registered voters with valid ID, 41.6% consider themselves Republican8 and 32.5% are Democrats. In contrast, among registered voters without proper ID, 34.8% are Republican and 38.0% are Democrats. Beyond the exclusion of certain demographic groups outlined above, this data suggests that a greater number of Democrats are excluded from voting under Indiana’s voter identification laws. (p. 12).
A major study on the impact of voter identification was conducted by scholars at Rutgers University and the Moritz School of Law, Ohio State University. The authors analyzed 2004 election data from around the country. Turnout in states with photo ID requirements was 58.1% compared with 64.2% in states that required voters to give their name as the main requirement (Rutgers, 2006). That's 10% lower turnout associated with a photo identification requirement.
Summary data from Rutgers study (p. 6)
In 2004, turnout was 10% higher in states where voter identification involved stating one's name than in states where a photo ID was required.
The researchers backed out states with photo ID requirements and found that Latino and black turnout was down disproportionately in states with another intensive identification requirement, signing an affidavit stating that you are the voter that you claim to be (Rutgers, p. 11).
Next Page 1 | 2 | 3 | 4 | 5 | 6
(Note: You can view every article as one long page if you sign up as an Advocate Member, or higher).


